Transformer Primary Current Monitoring |
(See Schematics Here) |
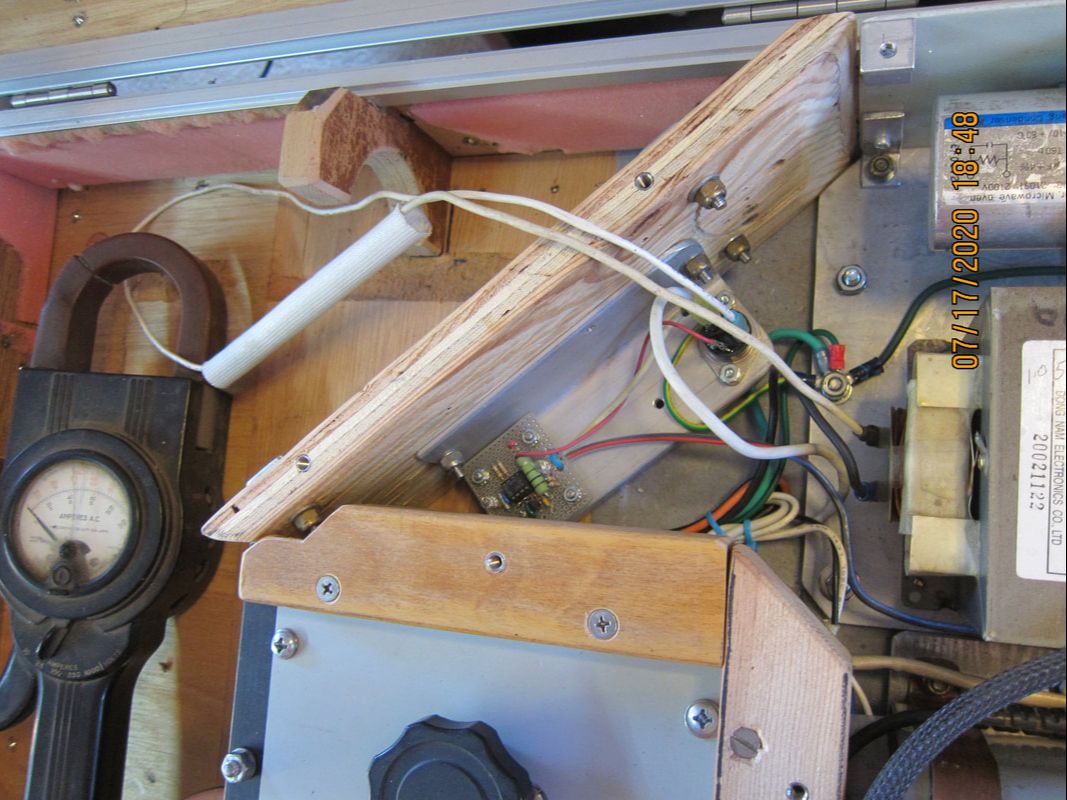
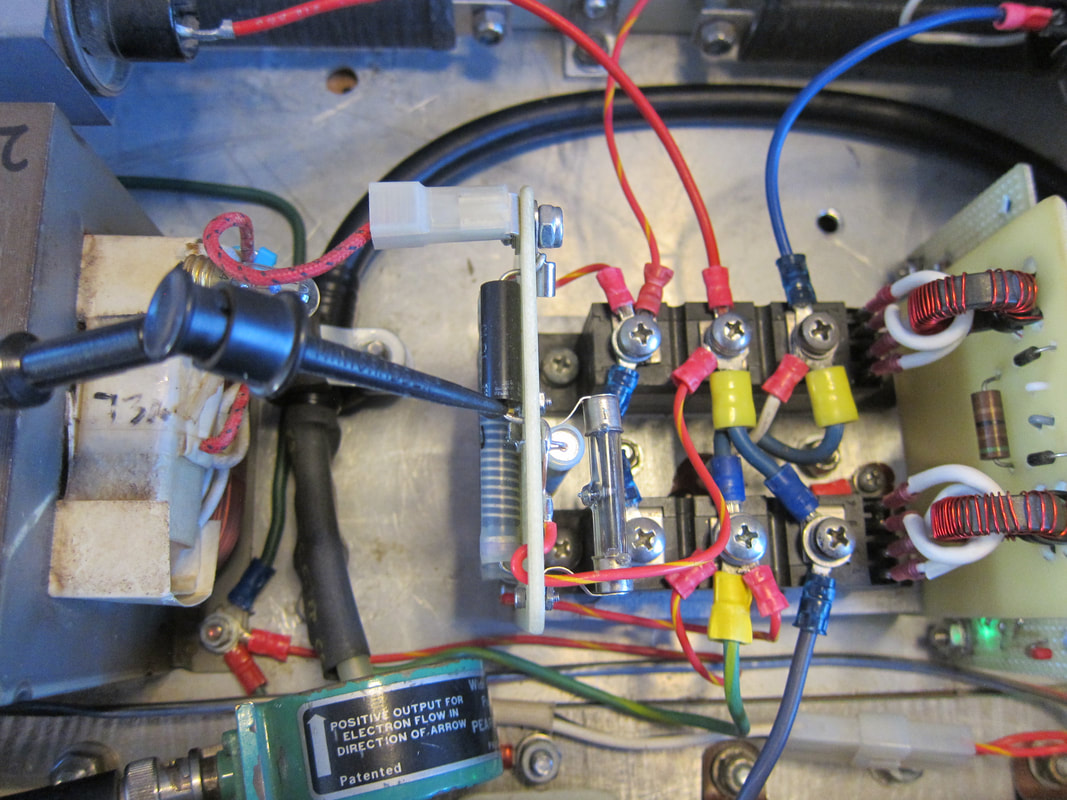
Above we see the lead that normally connects the Power Control Triac to the transformer primary has been replaced with a longer lead, which passes through the clamp-on Ammeter (seen to the left). This photo was taken with incorrect transformer phasing selected. (Transformer primary leads are swapped in the finalized system.)
Transformer AC Output Voltage Measurement
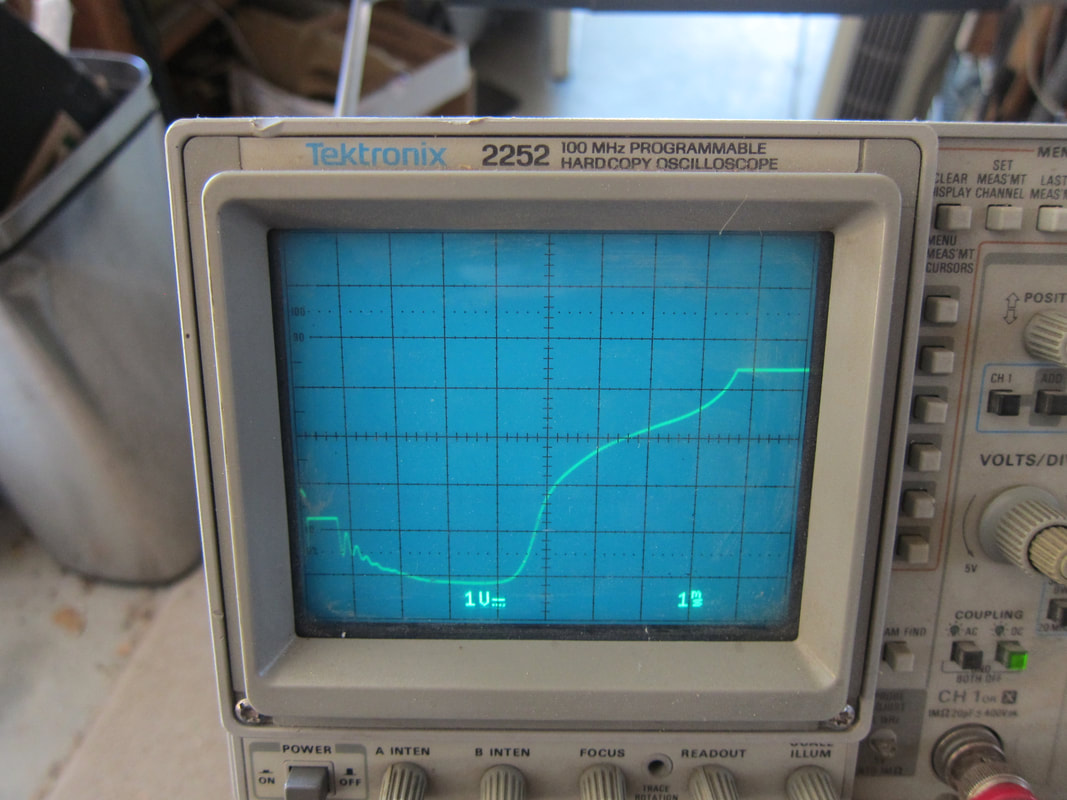
Shown Above: Correct High Voltage Transformer Phasing: capacitor voltage hits -1700 volts as transformer output is going negative. Capacitor charge appears briefly more negative than transformer output.
|
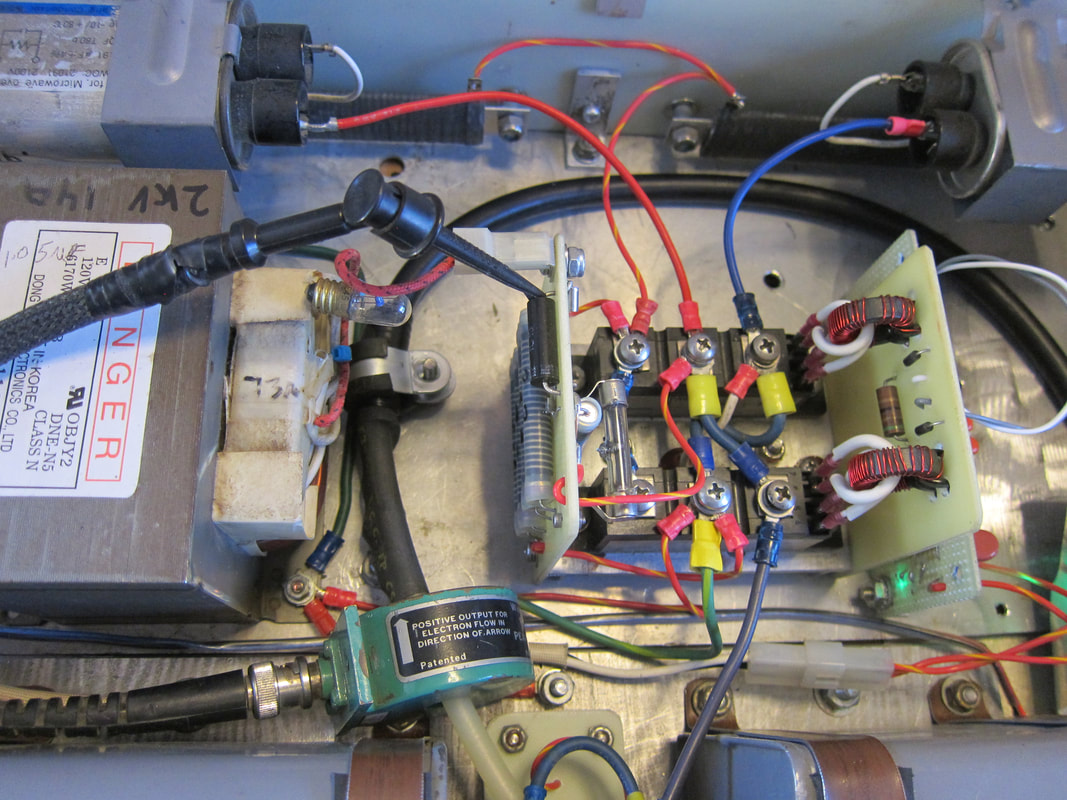
Shown Above: the compensated high voltage divider lead is connected to the high voltage rectifier input. A current Transformer monitors Applicator Coil current.
|
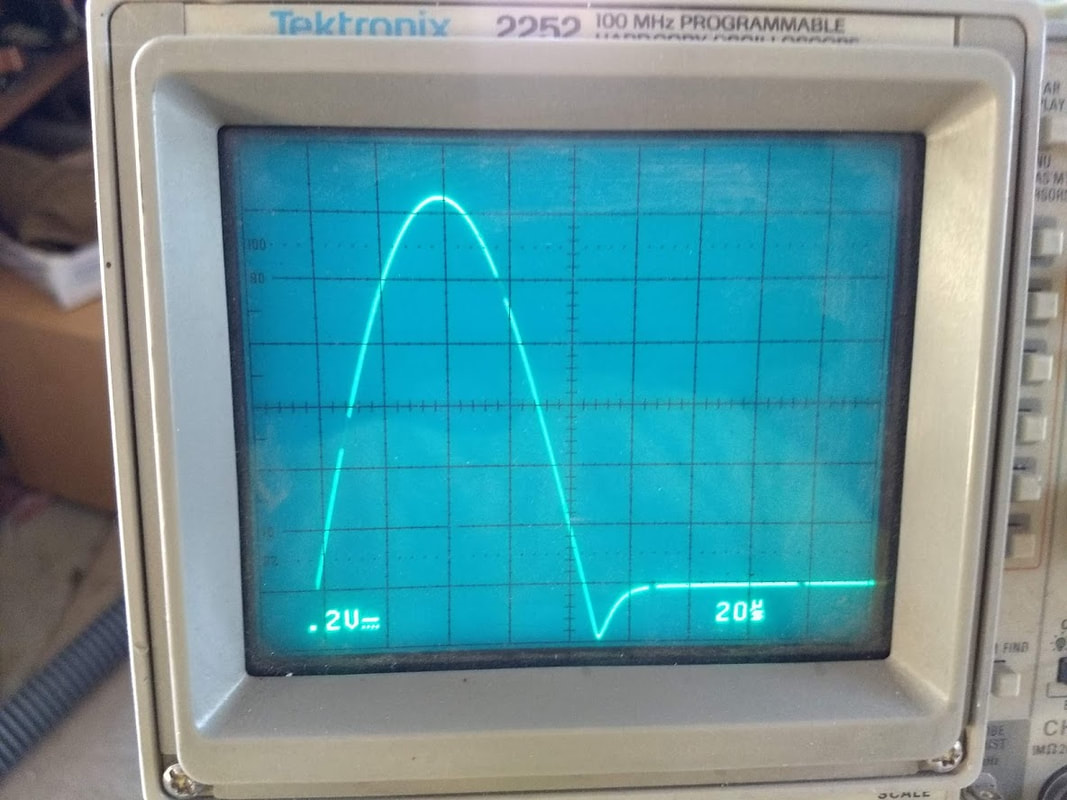
Transformer output voltage is viewed using a 1000:1 compensated high voltage divider. Vertical scale is 1000 volts per division, center-line is zero volts. Horizontal scale is 1 millisecond per division. Notice the pulse sequence precedes negative-going transformer output. Transformer primary current is 11 Amps. In this view, negative capacitor voltage appears initially (-1,700 Volts). Negative transformer output surpasses that after 700 microseconds, eventually dipping to -3,200 Volts. The microwave oven transformer is inductively shunted, so it shows non-sinusoidal output voltage waveform.
Incorrect Transformer Phasing, same measurement shown above (with primary leads swapped)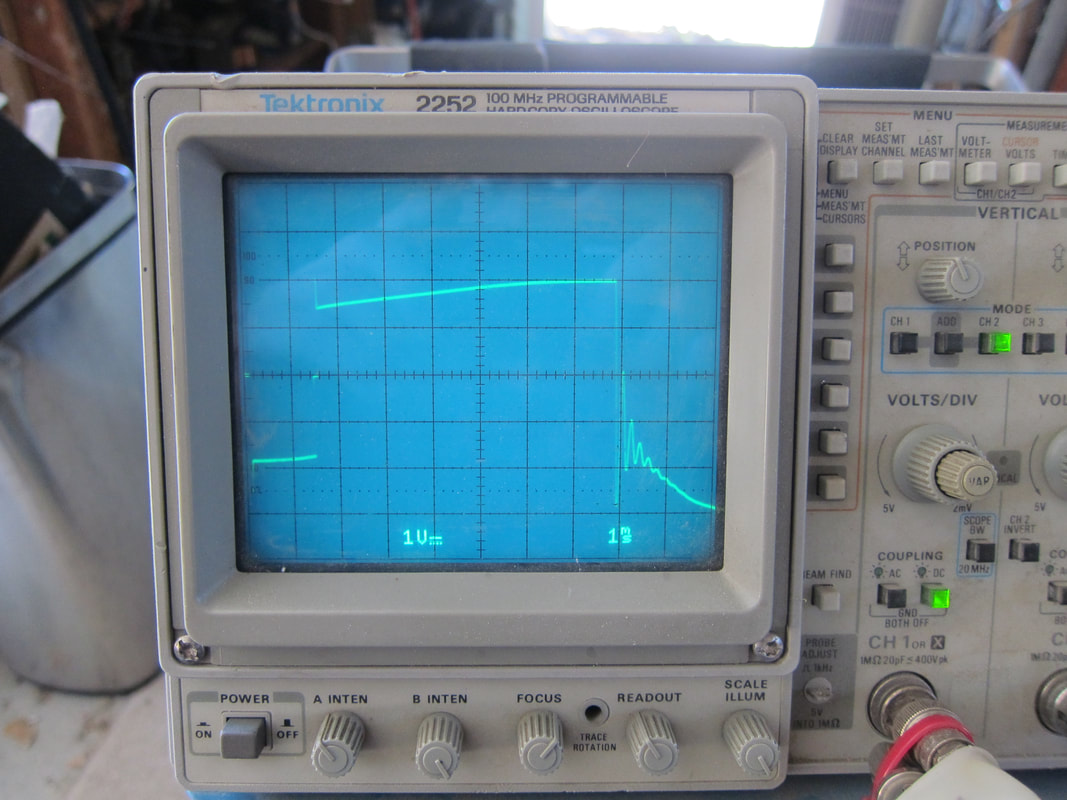
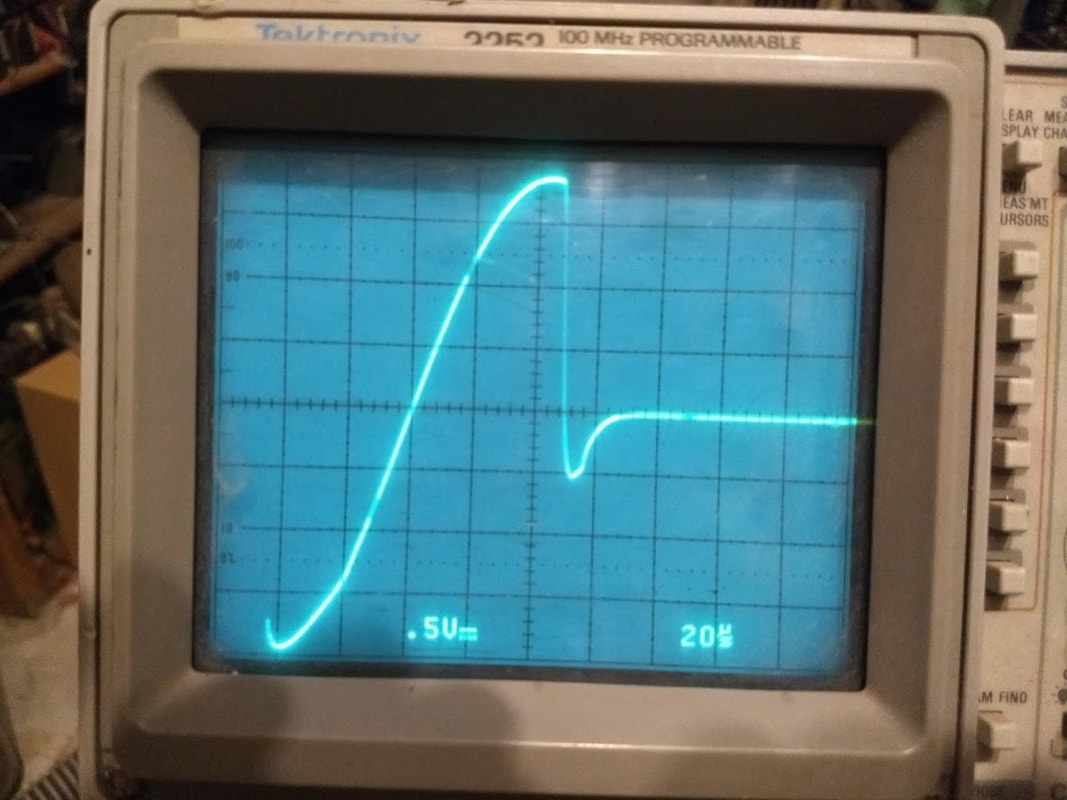
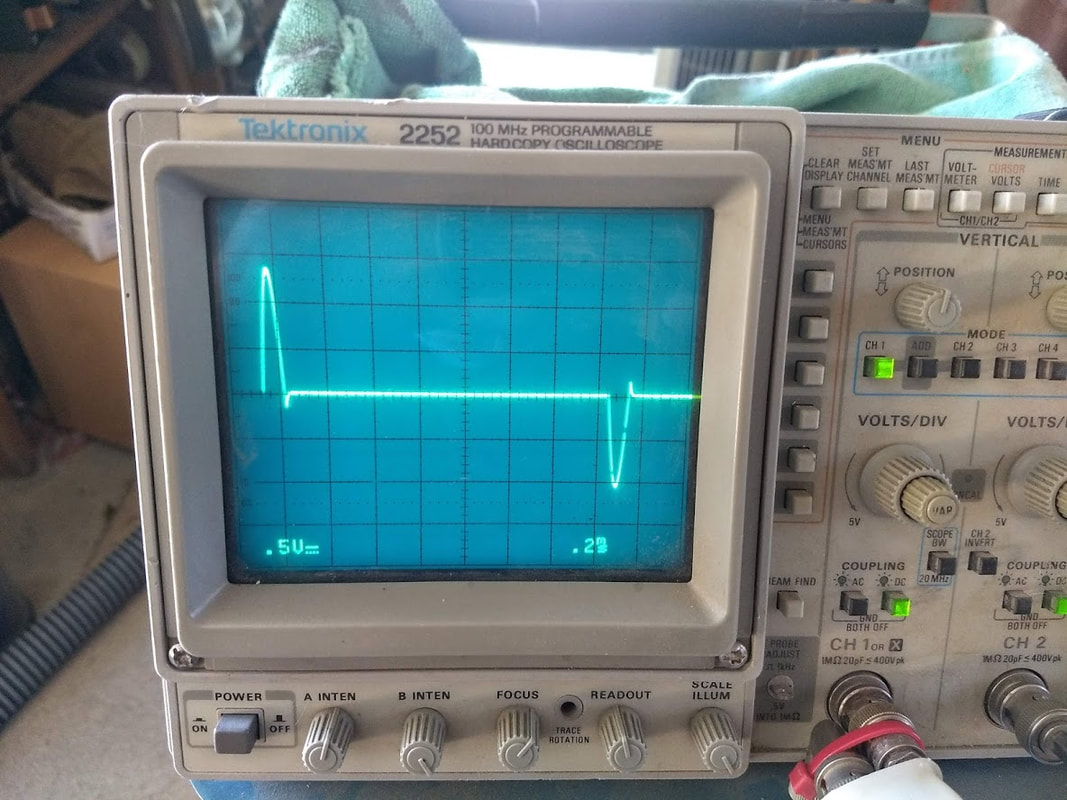
Shown Above: Incorrect High Voltage Transformer Phasing
Screen centerline represents zero volts. Vertical scale is 1000 volts per division. Sweep is triggered by the primary SCR firing. We get a glimpse of zero volts. Then we see -1700 volts (driven by resonant action): transformer output tracks that. Positive transformer output drives capacitor droop upward until the Ringback SCR fires, clamping voltage to zero again briefly. Resonant action ends with the Cap charged to +1500 volts. Then transformer output continues to recharge the capacitor positively. Transformer output eventually goes negative again, rather abruptly due to slow reverse recovery-time of the high voltage diode. |
Ross 1000:1 Compensated High Voltage Divider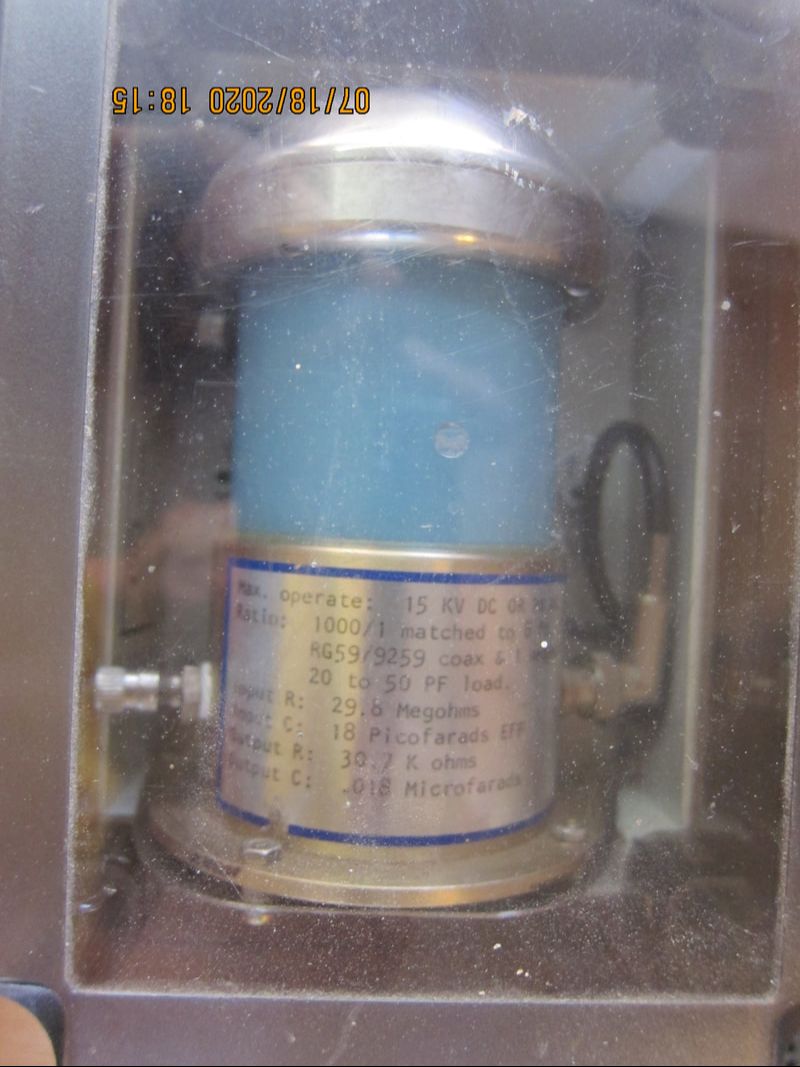
|
Incorrect phasing sends positive transformer output into the capacitor when capacitor-polarity goes negative briefly: transformer output is forced negative for that period. Fortunately the transformer is inductively shunted, which limits primary line current. Correct phasing can be identified with an Amp meter. We swap the transformer line connections while checking primary current. Current reads a couple amps lower with correct phasing (11 Amps versus 13 Amps in this system).
Peak Capacitor Voltage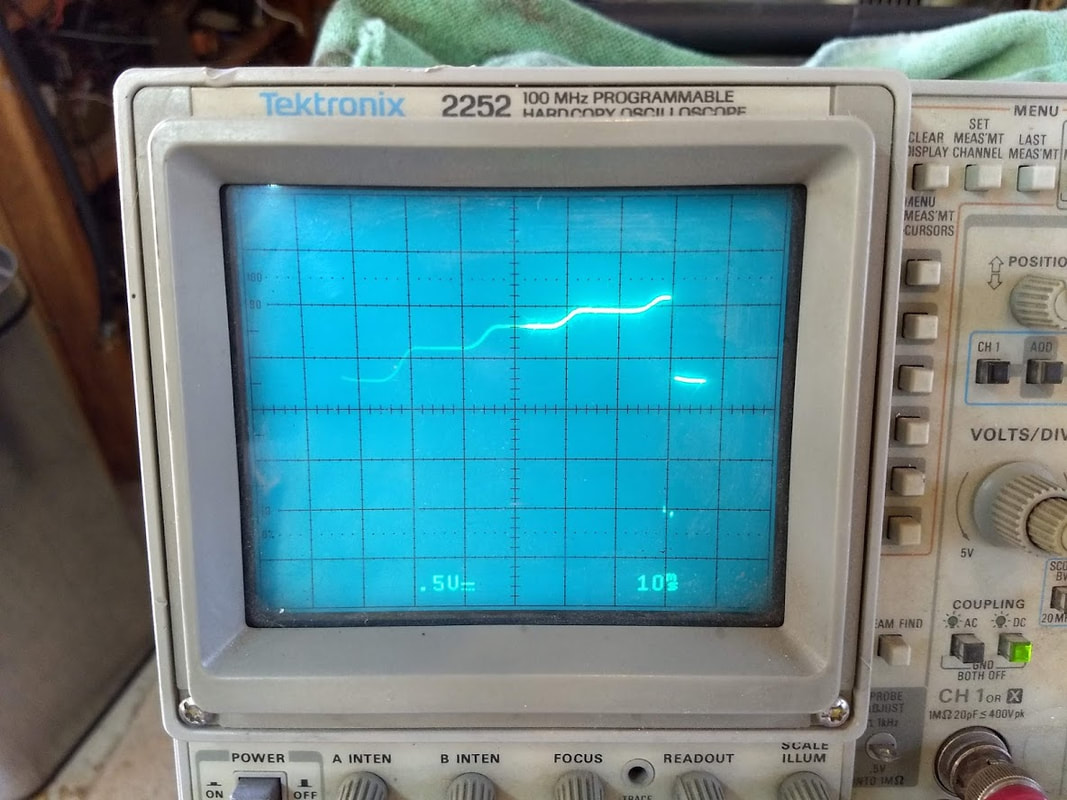
Peak Capacitor Voltage Measurement
Shown Above: Capacitor voltage rises higher and higher over the course of four successive power-line cycles, then the primary SCR dumps that charge into the Applicator Coil. |
To measure peak capacitor voltage, the lead from the compensated divider is connected to the high voltage rectifier output (as shown above). The current transformer remains positioned to monitor Applicator Coil peak current.
|
In the above view, the zero potential baseline is centered on the second division above the bottom. Vertical scale is 500 Volts per division. Line voltage is set for 120 VAC; final capacitor voltage reaches about +2,100 Volts.
Applicator Coil Voltage |
Applicator Coil Drive Current |
Shown above: the Primary SCR shorts the positive side of the capacitor to ground; the negative side of the capacitor drives the Applicator Coil. (The charged Capacitor is switched in parallel with the Applicator Coil.) The center line on the screen represents zero volts, scale is 500 volts per division: -2000 volts energizes the Applicator Coil. Field strength peaks as the capacitor reaches full discharge. Collapsing field then reverses capacitor polarity, charging it to about +1700 volts. SCRs used here have slow reverse recovery time, so some charge is lost back to the Applicator Coil. SCR reverse current switches OFF abruptly. Minor Applicator Coil field collapse produces a -500 volt spike (damped by a Resistor-Capacitor snubbing network of 20 Ohms and .45 microfarads).
Biphasic Pulse Current |
Peak current scale is 200 Amps per division, showing about 1240 Amps peak. My calibration is out of date, so these readings are only estimates.
|
|
Peak SCR Hold-Off Voltage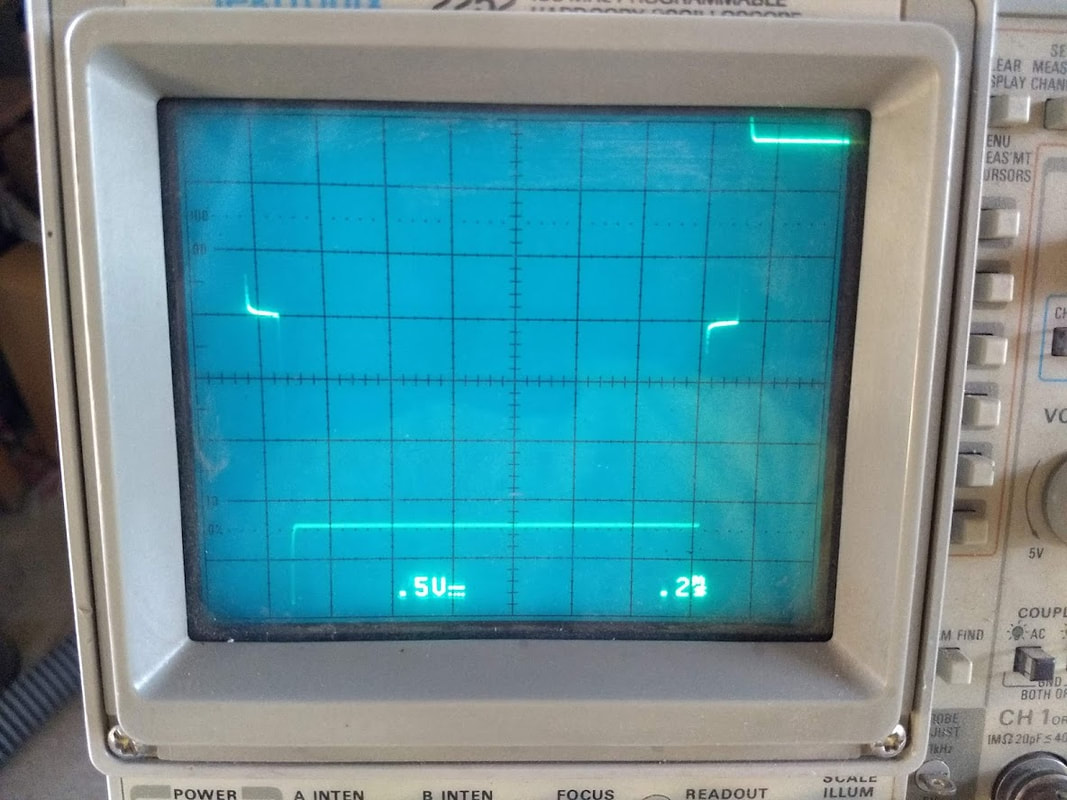
|
Above to the left we see the Primary SCR delivering 1300 Amps peak to the Applicator Coil. Then we see the Ringback SCR delivering -1050 Amps to the Applicator Coil. Above and to the right, we see voltage across the SCRs. (We can't see the voltage prior to the primary SCR firing, but that's shown above in the Peak Capacitor Voltage photo.) The zero-volt baseline is three divisions from the top. First we see Primary SCR conduction-voltage-drop, which is roughly zero volts. (Scale is 500 volts per division.) Primary SCR conduction ends. Primary SCRs abruptly withstand a reverse hold-off voltage of -2400 volts, then capacitor voltage settles to around -1700 volts. The Ringback SCR Fires and conduction-voltage drops to near zero. Ringback SCR conduction ends. Then we see a brief positive spike which goes off the screen, and finally capacitor voltage settles to about +1350 volts. I didn't have snubbing components in my first design: voltage across the SCRs peaked at -3200 volts. With snubbing applied, worst-case peak voltage is -2400 volts. We have two series-connected SCRs, so each SCR should see about 1200 volts peak, worst case. (Each SCR is rated for 1600 volts, so we also need to confirm voltage gets evenly split across both devices.)
Peak SCR Hold-Off Voltage (Continued)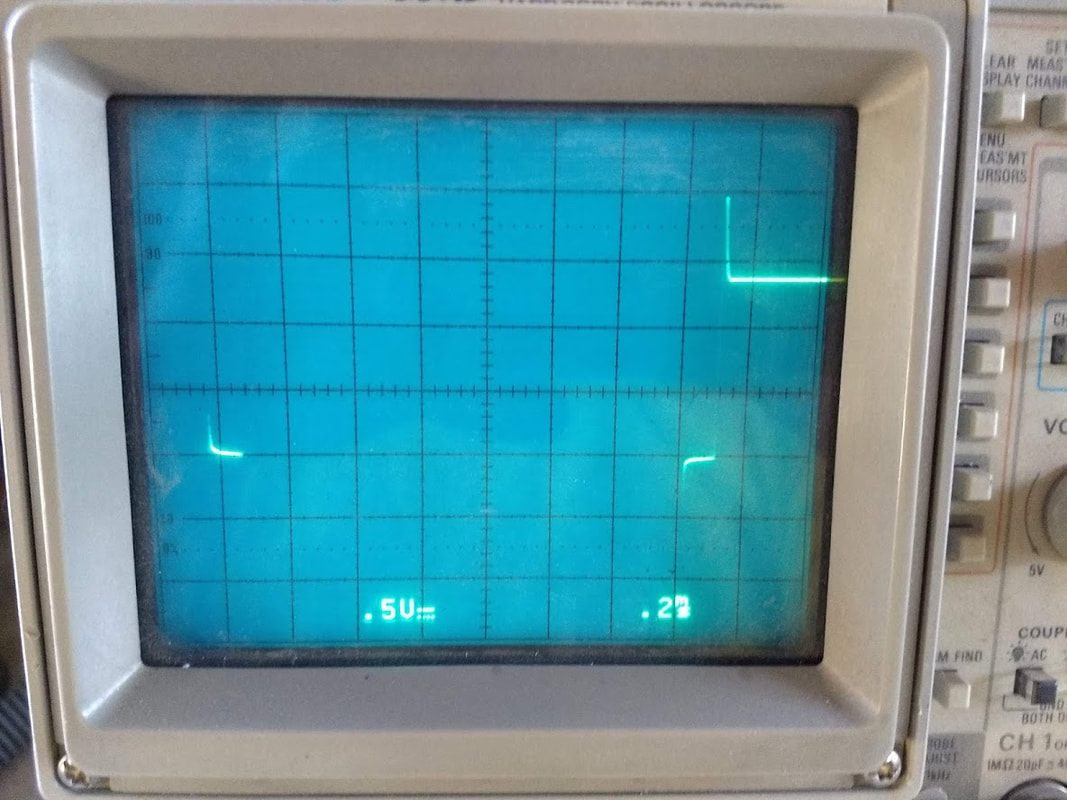
Above we see peak positive SCR hold-off voltage reaching about 2000 volts. (Ringback SCRs are connected antiparallel to the Primary SCRs, so this also represents reverse hold-off voltage for them.)
Test Data Sheet |
Series SCR Midpoint Voltage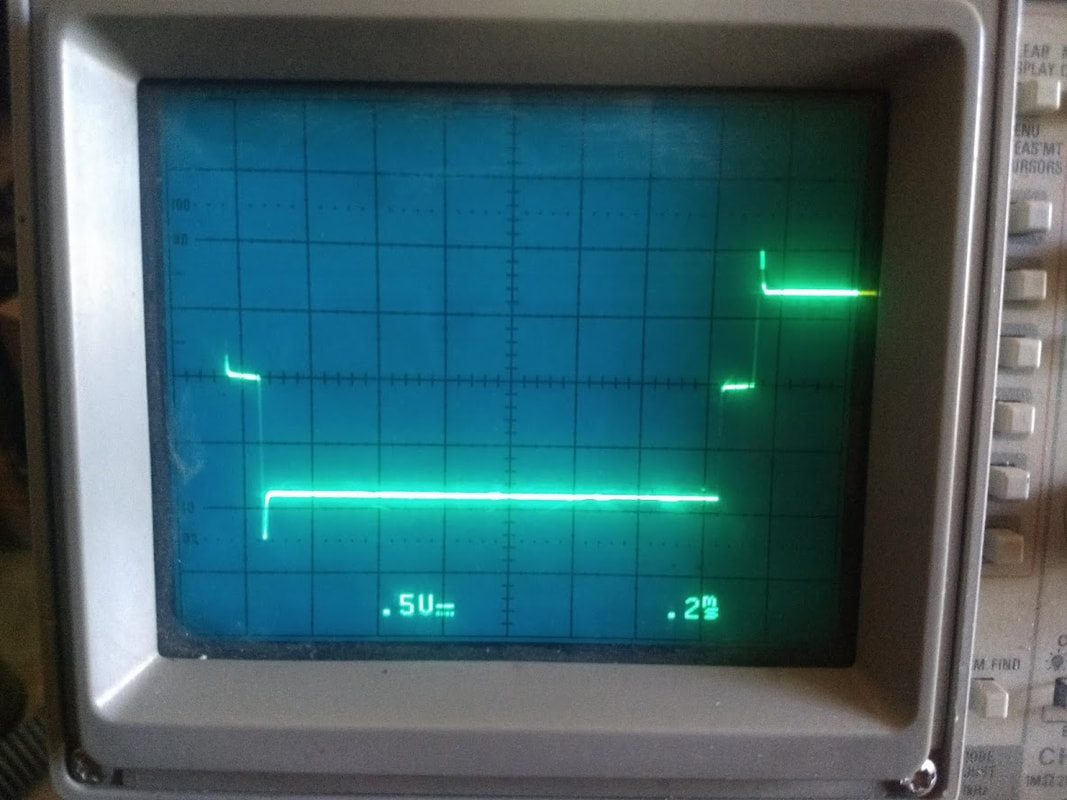
Above we see midpoint voltage between the two SCRs. Amplitude tracks at about half of Peak SCR Hold-Off Voltage (seen in the prior two photos). This confirms voltage is being split evenly across both series connected SCRs.
|

Simple TMS Design by Jeffrey Reagan is licensed under a Creative Commons Attribution 4.0 International License.
Based on a work at https://www.photonics.com/Article.aspx?AID=53525.
